
How Do the Three Financial Statements Fit Together?
Financial statements are important tools for understanding a company’s financial health. Essentially, financial statements bring together different aspects of an organization’s performance.
Each financial statement summarizes the company’s performance over a specific period. The three financial statements can be used to identify trends in a company’s performance and to make informed decisions about investing in or investing against a company.
These financial statements are the income statement, the balance sheet, and the cash flow statement.
A: Income Statement: What Is It and What Does It Tell Us?
An income statement is a report that shows the financial status of a company or organization. It contains information about the revenue and expenses of a business during a specific period of time. This report can help investors, creditors, and others make decisions about how to invest in or support a company.

The most important part of an income statement is the profit and loss (P&L) section. This section tells investors how much money the business made from its sales and operations during the specified period. The P&L also shows how much debt the business has incurred, which is an indication of its financial health.
How To Interpret the Income Statement: Key Indicators and What They Mean
The following are some key indicators on the income statement:
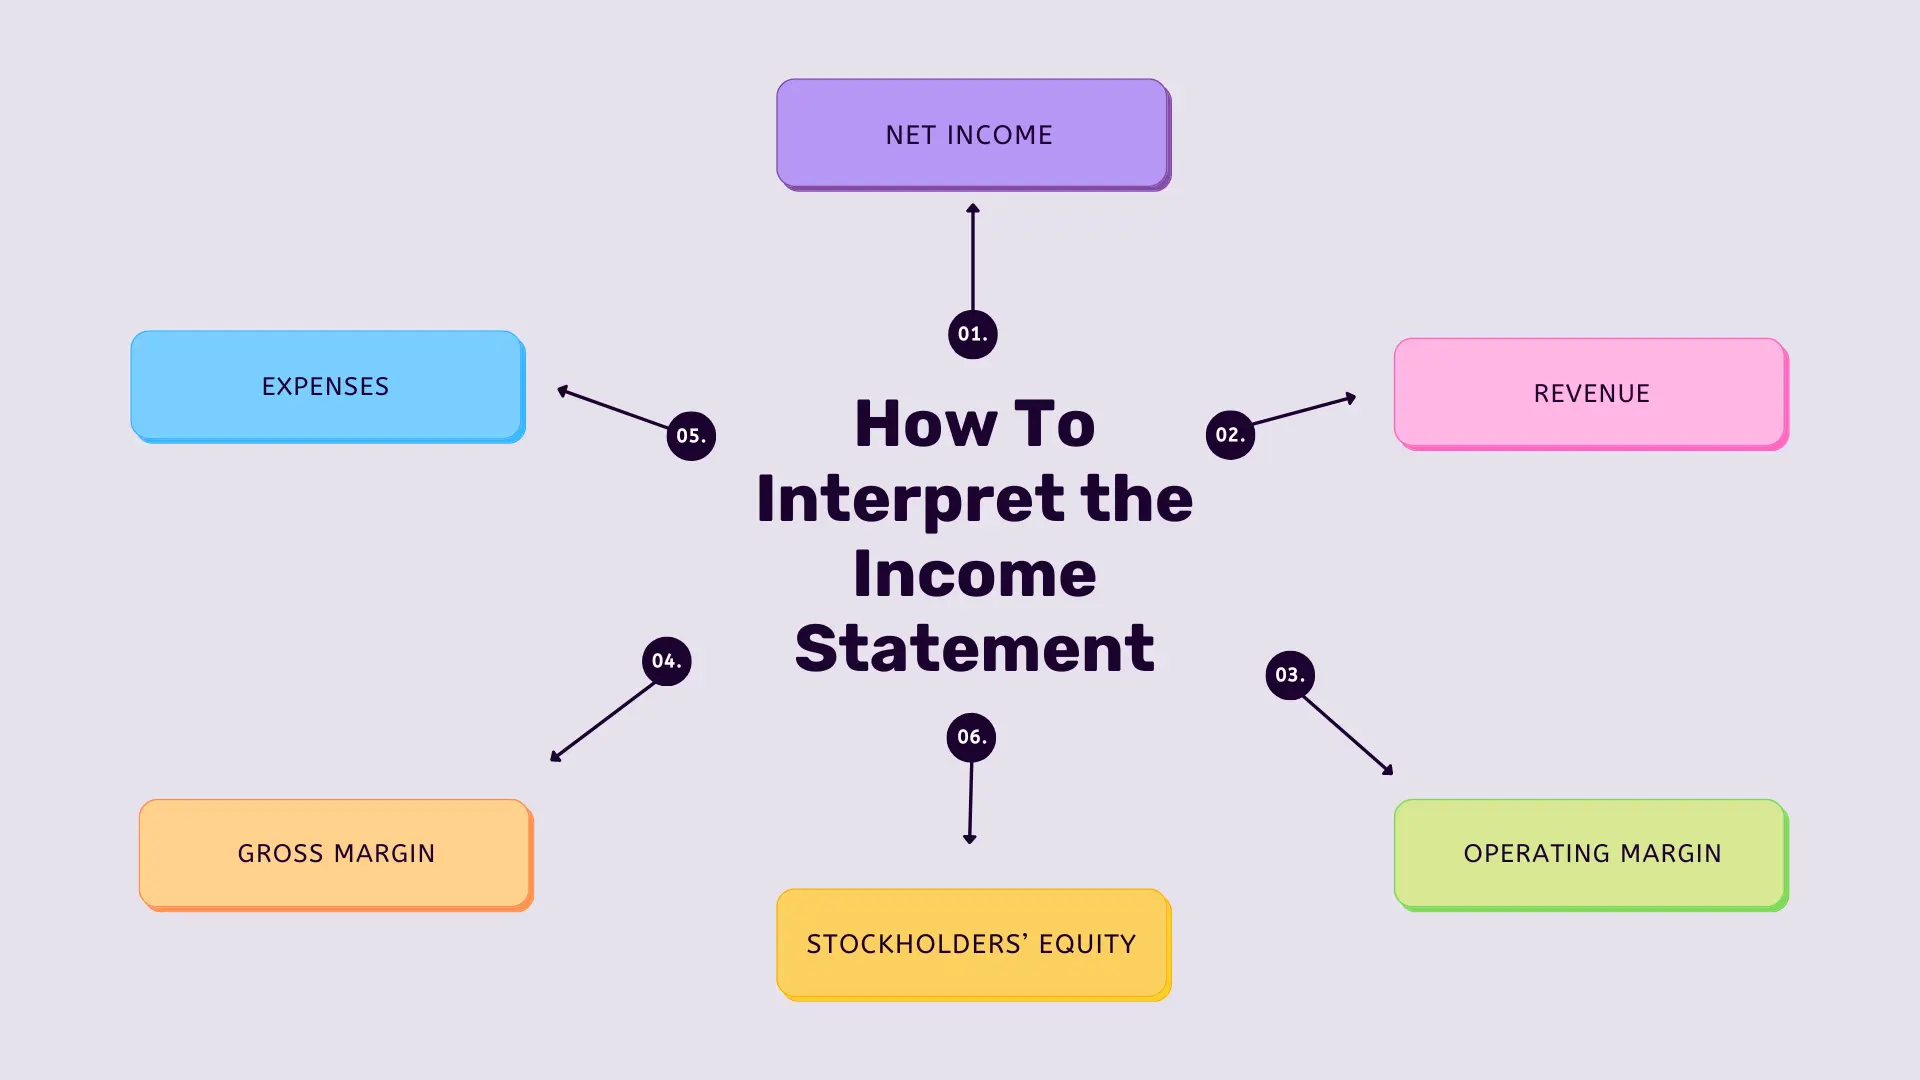
a. Net income: Net income is the amount of money a company makes after paying all its expenses, including taxes. This figure is important because it shows how profitable the company was during the period that was analyzed.
b. Revenue: Revenue is the total amount of money that a company earns from its various activities. This can include sales, fees, and other income sources. Revenue is an important factor in determining a company’s success.
c. Expenses: Expenses can be broadly divided into two categories: direct and indirect. Direct expenses are those that are directly related to the provision of goods or services, such as salaries, wages, and rent. Indirect expenses are those that are not directly related to providing goods or services, such as marketing costs, administrative costs, and depreciation.
d. Gross margin: Gross margin is the difference between a company’s sales and its cost of goods sold. It is a key measure of profit and performance. Gross margin reflects the company’s ability to generate profits from its sales.
e. Operating margin: Operating margin is a financial metric that reflects the efficiency of a company’s operations. It is calculated as the difference between a company’s net income and its operating expenses. A high operating margin indicates that the company is able to generate higher profits with fewer resources than its competitors.
f. Stockholders’ equity: In the context of a corporation, stockholders’ equity represents the net worth of a company as divided between its owners (stockholders) and creditors. This figure includes both the value of a company’s common stock and any additional paid-in capital (money contributed by shareholders after issuance of stock). Stockholders’ equity represents one important measure of a company’s financial health and can be used to determine whether it is over or undervalued. Have a look at the guide we have provided on how to invest in stocks.
How to Use Income Statements to Analyze Financial Performance and Plan for Future Growth
There are a few key items on an income statement that should always be included, regardless of the company or sector. Net income is perhaps the most important line on an income statement, as it shows how much money the company has made after expenses and taxes. Other lines to look for include Revenue (how much money was brought in), Expenses (everything from wages to advertising costs), and Profit & Loss (the difference between Revenue and Expenses).
An income statement can provide a lot of valuable information about a company’s financial health, so it’s important to know how to read it. Make sure you understand each line before looking at the column totals; otherwise you might be misled by misleading totals. And if there are any questions about a company’s financial performance, be sure to ask your accountant or financial advisor for help.
B: Balance Sheet: What Is It and What Does It Tell Us?
A company’s balance sheet is a snapshot of its financial health at a particular point in time. It shows the total assets, liabilities, and net worth of the company. The balance sheet can be used to measure a company’s financial strength and stability.
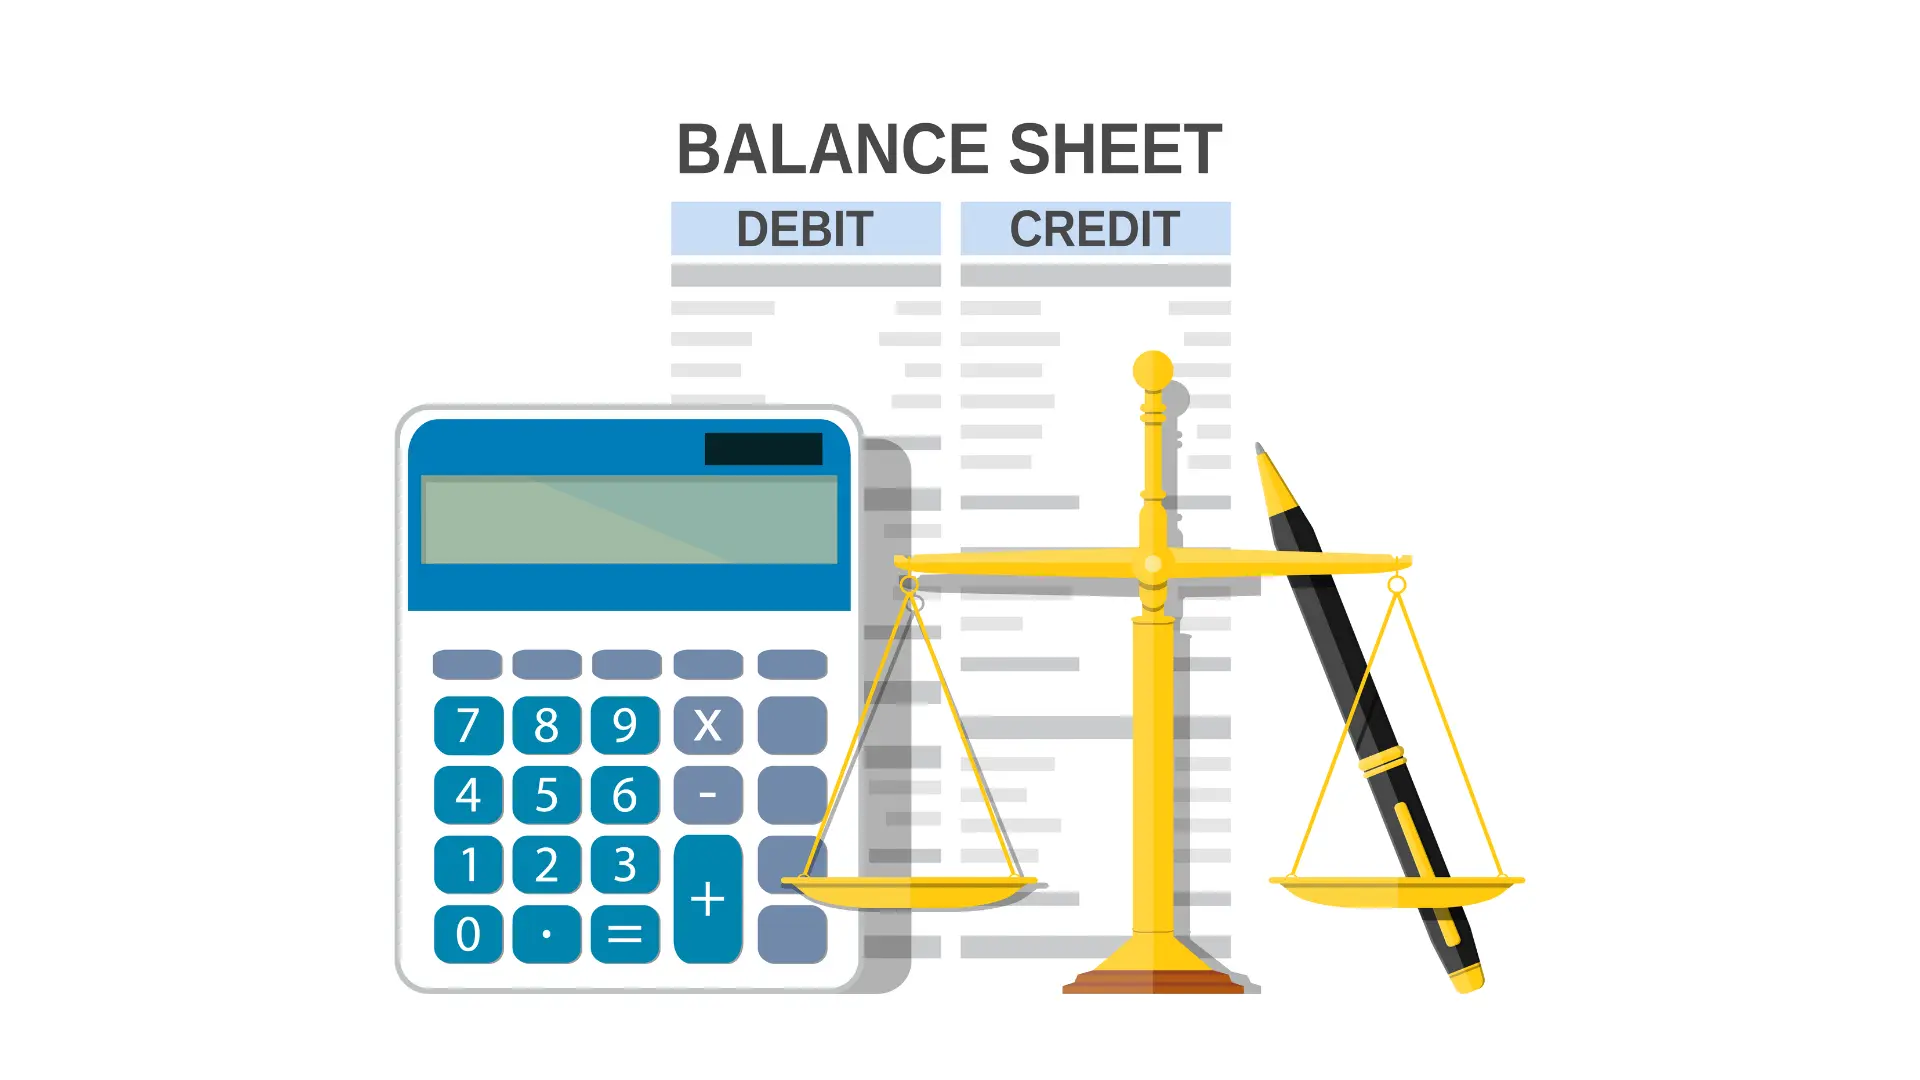
The three main components of a company’s balance sheet are its assets, liabilities, and net worth. Assets are everything that a company owns, including cash and investments. Liabilities are the obligations that a company has to other people or organizations, such as debt payments or promises to pay a future income. Net worth is simply the sum of an asset’s value minus its liabilities.
Balance sheets can be used to determine a company’s ability to repay its debts and afford future expenses. A healthy balance sheet signals that a business is financially stable and has enough resources available to continue operating without difficulty.
How To Interpret the Balance Sheet: Key Indicators and What They Mean
The following are some key indicators on the balance sheet:

a. Assets: These are everything a company owns, including cash, investments, and real estate.
b. Liabilities: These are everything a company owes, including loans and credit card bills. This figure also includes both short- and long-term debts.
c. Net worth: This is calculated by subtracting liabilities from assets.
d. Cash and cash equivalents: This number shows how much money the company has available to pay its bills and invest in new projects.
e. Short-term debt: This figure reflects the amount of money that the company owes within one year, including short-term loans from banks and other lenders.
f. Long-term debt: This figure reflects the amount of money that the company owes beyond one year, including long-term loans from investors or government agencies.
How to Use Balance Sheet Statements to Analyze Financial Performance and Plan for Future Growth
Balance sheet statements are a good way to analyze financial performance and plan for future growth. The most important part of the balance sheet is the statement of assets, liabilities and equity. This section shows how much money the company has in total. Next is the statement of operations, which shows how much money the company earned from its activities last year. Finally, the statement of cash flow shows how much cash the company had at its disposal last year. This information can help you understand whether the company was able to generate sufficient revenue and profits to cover its expenses.
Balance sheet statements also can be helpful when deciding whether or not to invest in a particular company. By understanding a company’s financial health, you can make an informed decision about whether or not to invest your money.
C: Cash Flow Statement: What Is It and What Does It Tell Us?
Cash flow statement is a financial statement that tracks the cash coming into and going out of a company. The cash flow statement shows how much cash was brought in, what bills were paid, what investments were made and how much money was left over after all expenses were paid. This information can be helpful for investors, as it can help them understand how well a company is doing financially. Have a look at the detail about what is investment income.

One of the most important things to look at on a cash flow statement is the change in cash. This shows how much money the company has generated or lost in comparison to the previous year. Changes in assets and liabilities are also important to monitor on a cash flow statement. For example, if a company sells more products than it buys, this would result in an increase in liabilities (such as Accounts Payable).
How To Interpret the Cash Flow Statement: Key Indicators and What They Mean
The following are some key indicators on the cash flow statement:
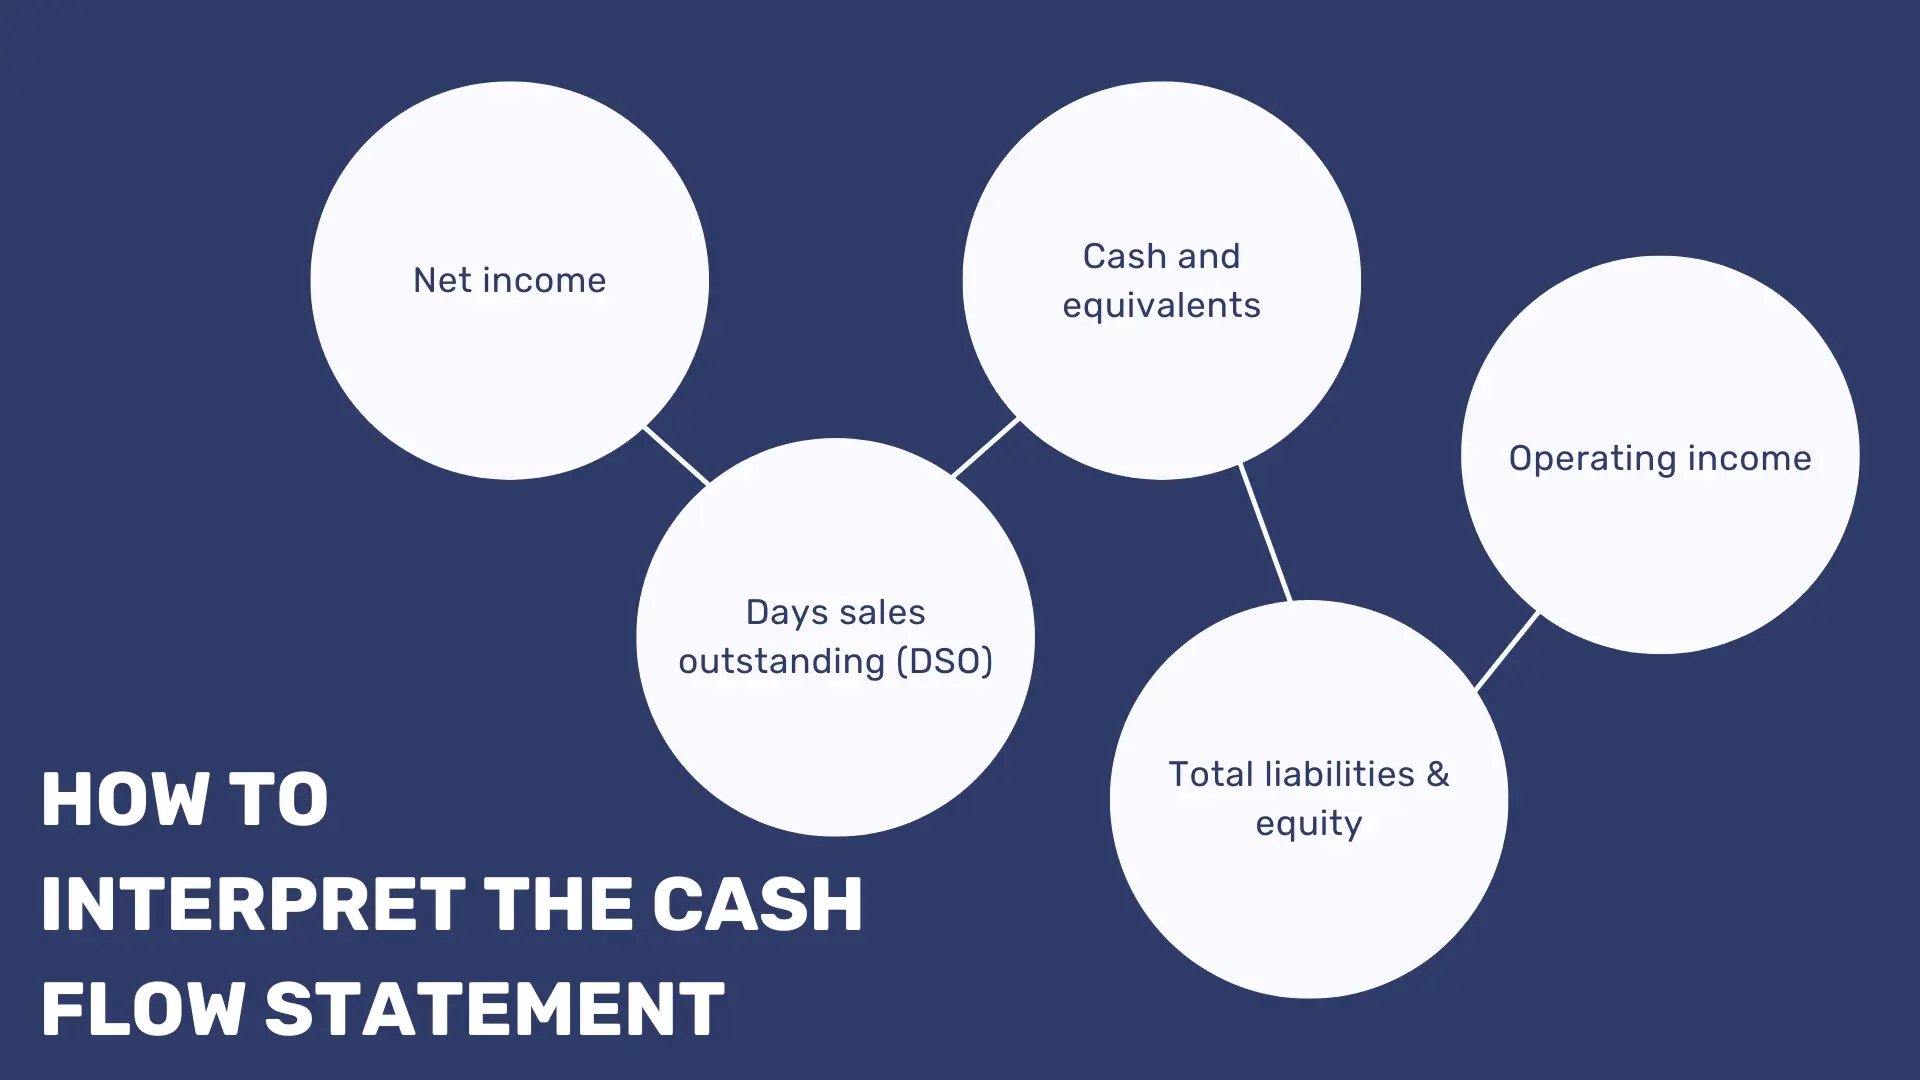
a. Net income: This is a figure that shows how much money the business made after paying all its bills.
b. Cash and equivalents: This figure shows how much cash the business has on hand, plus any short-term investments that are considered liquid.
c. Operating income: Operating income is a common term in business that is used to describe the profits of a company after all its expenses have been paid. This includes everything from rent, salaries, and marketing costs to factory overhead and supplies. Operating income is one measure of a company’s financial health and can be used to compare different companies or periods of time.
d. Days sales outstanding (DSO): This measure of liquidity shows how long it would take for the company to run out of cash if it did not receive any new payments from customers.
e. Total liabilities & equity: This figure shows both the total amount of money owed by the business and its owners’ equity (the remaining value of their shares).
Net income is often considered to be the most important indicator on the cash flow statement because it reflects a company’s ability to generate profits. Net income can be broken down into operating income (earnings from operating activities before depreciation and amortization) and non-operating income (interest, dividends, rental income, etc.). Operating income is equally important because it tells you how well a company is doing financially while operating its businesses.
How to Use Cash Flow Statements to Analyze Financial Performance and Plan for Future Growth
An investor can use cash flow statements to analyze financial performance and plan for future growth. A cash flow statement reflects a company’s ability to generate cash from its operations by showing the change in cash and cash equivalents, as well as other investments such as short-term loans. By understanding how much money a business generates from each category of activity, investors can make informed decisions about whether to invest in that company. Additionally, knowing where a company is heading allows for more strategic planning when it comes to future growth.
Here are tips for using cash flow statements to your advantage:
- Look at the trend lines in the cash flow statements. These will show you how a company is performing over time, and whether there are any changes in trends that might signal trouble ahead.
- Use the cash flow statement as a tool for budgeting and planning.
How Do the Three Financial Statements Fit Together?
In summary, the balance sheet is a snapshot of a company’s financial health at a specific point in time; the statement of cash flows shows how much money the company has earned and spent during a specific period of time; the income statement breaks down revenue and expenses into different categories to provide a clearer picture of how profits are generated. Comparing the three financial statements can help companies identify any areas of weakness or opportunity, and make strategic decisions accordingly.
If you are considering investing in a company, and need access to its financial statements, you may:
- Contact the company directly. Many companies will provide their financial statements free of charge or for a fee that is determined by the size of the request.
- Search online databases. Several online databases, such as FactSet and Capital IQ, offer free access to companies’ financial statements.
- Request copies from the SEC. The SEC (the US Securities and Exchange Commission) also offers free copies of several types of filings, including annual reports, quarterly reports, and Form 8-Ks (a form filed when there is significant news about a company).
By getting these statements and fitting them together, investors can better assess a company’s health and future prospects.